

This article will guide you through the process of setting up a robust monitoring system on Linux servers with popular open-source tools. We’ll cover the installation, configuration, and integration, providing valuable insights into server performance with pre-built dashboards. Whether you’re a seasoned DevOps engineer or just starting, this comprehensive tutorial ensures optimal server monitoring and real-time metrics visualization.
Step-by-Step Guide
Install and configure Prometheus on a Linux server
Collect Linux system-level metrics with Node Exporter
Integrate and visualize metrics in Grafana
Prerequisites
Basic knowledge of observability/monitoring concepts.
Familiarity with the command line interface (CLI).
An AWS account and an EC2 instance up-and-running.
Configured security group. Think of it as firewall rules. You need to open a port
9090for Prometheus,9100for Node Exporter,3000for Grafana.
For demo purposes, I will be using a t3.small instance based on Ubuntu Server 22.04 LTS (HVM), SSD Volume Type AMI*.*
Alertmanager is out of scope for this tutorial; however, you may open the port 9093for future use.

Prometheus vs Node Exporter vs Grafana
Setting up a monitoring system with Prometheus, Node Exporter, and Grafana is essential for gaining real-time insights into Linux server performance, identifying potential issues, and ensuring optimal resource utilization.
If this is your first time hearing about these tools, here’s a quick overview.
Prometheus is an open-source monitoring and alerting system that collects metrics and time-series data from various sources. It acts as a central data store, processing and storing metrics data over time. Prometheus has its own query language (PromQL) for querying and analyzing metrics.
Node Exporter is a Prometheus exporter specifically designed to collect system-level metrics from Linux/Unix servers. It provides various metrics related to CPU usage, memory utilization, disk I/O, network traffic, and more. Node Exporter exposes these metrics in a format that Prometheus can scrape and store for further analysis.
Grafana is an open-source data visualization and monitoring tool that allows users to create interactive and customizable dashboards. It supports various data sources, including Prometheus.
Prometheus, Node Exporter, and Grafana are often used together in a monitoring setup, where Node Exporter provides system-level metrics to Prometheus, and Grafana visualizes the data from Prometheus. However, each component can also function independently.
Setting up Prometheus on a Linux server
Open a new terminal and connect to your EC2 instance via SSH.
ssh -i path/to/private_key.pem username@public_ipv4_address
If you’re comfortable with it, switch to the rootuser. Otherwise, for certain commands, you may need to add sudobefore them.
sudo -i
Download a precompiled binary. Check out the download section for a list of available versions.

As of the time of this article’s writing, version v2.45.0 was the most recent release available.
The following set of commands will download the precompiled binary, untar it, rename the directory and cdinto it.
wget https://github.com/prometheus/prometheus/releases/download/v2.45.0/prometheus-2.45.0.linux-amd64.tar.gz tar -xvf prometheus-2.45.0.linux-amd64.tar.gz mv prometheus-2.45.0.linux-amd64 prometheus cd prometheus
You should see something like this:

The Prometheus server is a single binary called prometheus(or prometheus.exe on Windows). Before starting Prometheus, we need to configure it.
Prometheus configuration is a YAML file. When you download Prometheus, it also comes with a sample configuration.
# my global config global: scrape_interval: 15s # Set the scrape interval to every 15 seconds. Default is every 1 minute. evaluation_interval: 15s # Evaluate rules every 15 seconds. The default is every 1 minute. # scrape_timeout is set to the global default (10s).
# Alertmanager configuration alerting: alertmanagers: - static_configs: - targets: # - alertmanager:9093
# Load rules once and periodically evaluate them according to the global 'evaluation_interval'. rule_files: # - "first_rules.yml" # - "second_rules.yml"
# A scrape configuration containing exactly one endpoint to scrape: # Here it's Prometheus itself. scrape_configs: # The job name is added as a label `job=<job_name>` to any timeseries scraped from this config. - job_name: "prometheus"
# metrics_path defaults to '/metrics' # scheme defaults to 'http'.
static_configs: - targets: ["localhost:9090"]
To configure our server, you can retain the default configuration and update the targetsor simply copy the following configuration and paste it into prometheus.yml to keep it minimal.
You can use the public IPv4 address of your instance or public IPv4 DNS as a target.
global: scrape_interval: 15s scrape_configs: - job_name: "prometheus" static_configs: - targets: ["public_ipv4_address:9090"]
There are two blocks of configuration in this example: globaland scrape_configs. In global block, we control how often Prometheus will scrape targets. In scrape_configs block we control what resources Prometheus monitors. As Prometheus can scrape and monitor its own health, there is a single job named “prometheus” responsible for scraping the time series data exposed by the Prometheus server running on our EC2 instance at port 9090.
To start Prometheus, execute the following command:
./prometheus --config.file=prometheus.yml
The expected output will be as follows:

Access the Prometheus UI in your browser.

You can confirm Prometheus is serving metrics by accessing its own /metrics endpoint or you can usecurl:

Prometheus Metrics
curl http://public_ipv4_address:9090/metrics
To get a glimpse of the data collected by Prometheus about itself, let’s navigate to /graph and utilize Prometheus' built-in expression browser.
For example, we want to see the total number of /metrics requests the Prometheus server has served but we are only interested in those that result in HTTP code 200.

That’s it. We have our Prometheus server up and running. Let’s collect more metrics.
Collecting Linux system-level metrics with Node Exporter
The Prometheus Node Exporter exposes a wide variety of hardware and kernel-related metrics so it’s the best way to collect all the Linux server-related metrics for monitoring.
Open a new terminal and connect to your EC2 instance. Once again, check out the download section for a list of available versions.

As of the time of this article’s writing, version v1.6.1 was the most recent release available.
The following set of commands will download Node Exporter, untar it, rename the directory and cd into it.
wget https://github.com/prometheus/node_exporter/releases/download/v1.6.1/node_exporter-1.6.1.linux-amd64.tar.gz tar -xvf node_exporter-1.6.1.linux-amd64.tar.gz mv node_exporter-1.6.1.linux-amd64 node_exporter cd node_exporter
You should see something like this:

Start Node Exporter:
./node_exporter
The expected output will be as follows:

Verify Node Exporter is serving metrics on port 9100:
curl http://public_ipv4_address:9100/metrics
Or:

Now that we have the Node Exporter up and running on the server, we have to add this server as a target on the Prometheus server configuration for Prometheus to access the Node Exporter metrics.
In Prometheus UI, if we tried to look up thenode_network_receive_bytes_totalmetric, we’d see there’s no such metric.

Update prometheus.ymlscrape_configs block to enable scraping Node Exporter.
- job_name: node-exporter static_configs: - targets: ['public_ipv4_address:9100']
Navigate to http://public_ipv4_address:9090/targets

Now that Prometheus is scraping metrics from a running Node Exporter, let’s try again and this time let’s use the available metric to conduct a query:

The query rate(node_network_receive_bytes_total[1m]) is calculating the average network traffic received, per second, over the last minute (in bytes).
Integrate and visualize metrics in Grafana
With both Prometheus and Node Exporter up and running, it’s time to configure Grafana and create some visually appealing dashboards.
Open a new terminal and connect to the instance. The following set of commands will install Grafana.
sudo apt-get install -y adduser libfontconfig1 wget https://dl.grafana.com/oss/release/grafana_10.0.2_amd64.deb sudo dpkg -i grafana_10.0.2_amd64.deb
As of the time of this article’s writing, version v10.0.2 was the most recent release available. To start the Grafana server, execute the following command:
sudo /bin/systemctl start grafana-server
By default, Grafana will be listening on port 3000. The default login is “admin” / “admin”.


Grafana supports querying Prometheus. So make sure the Prometheus endpoint is accessible from the Grafana server.
To create a Prometheus data source in Grafana:
Open the Configuration menu.
Click on “Data Sources”.

Click on “Add data source”.
Select “Prometheus” as the type.

- Set the appropriate Prometheus server URL (for example,
[http://public_ipv4_address:9090/](http://localhost:9090/%29)) and Save & Exit.

You can create your own custom dashboards or import a pre-built dashboard. Grafana maintains a collection of shared dashboards which can be downloaded and used with standalone instances of Grafana. One of the most popular dashboards is Node Exporter Full.
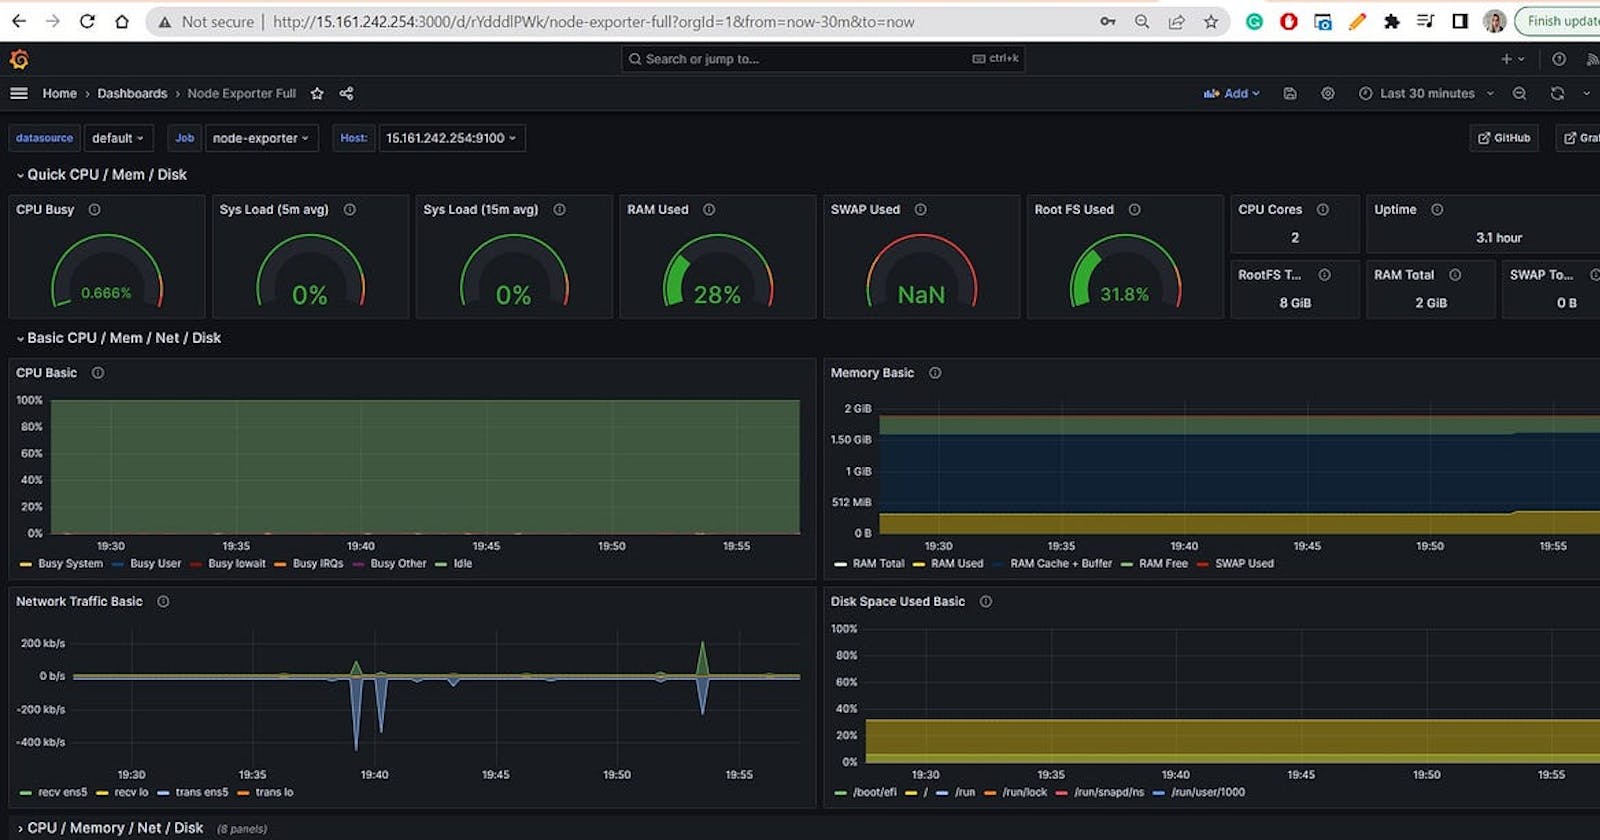
Let’s import the Node Exporter pre-built dashboard. Go to /dashboards and select “New” > “Import”.

There are several ways to import dashboards, we’ll import via grafana.com.
To retrieve the Dashboard ID, find the desired dashboard in a shared library and select “Copy ID to clipboard”.


Import via grafana.com
Load and select the Prometheus data source. Finally, Import.

This dashboard gives an overview of your Linux hosts and provides details related to CPU/Memory/Disk Usage, Network Traffic, I/O requests and more.

Troubleshooting
A common error you may encounter while trying to run Prometheus is as follows:
caller=main.go:833 level=error msg="Unable to start web listener" err="listen tcp 0.0.0.0:9090: bind: address already in use"
You need to find the process id (pid) of whatever is running on that port and kill it to free up the port so you can run Prometheus.
lsof -i :9090
sudo kill -9
Keep in mind
While the setup was relatively straightforward, it is advisable to create a dedicated user other than root for running specific services. This will isolate Prometheus and add a protection layer to the system.
Additional Resources
Thank you for taking the time to read my article! If you found it valuable, I invite you to follow my blog for similar content in the future. I regularly share insights and tips on DevOps and Cloud, and I would be thrilled to connect with you.